
November 05, 2025
Here’s how we used Telary to learn about airplane safety.
Finding the data
First, we had to find the data. We decided to work with the NTSB, which tracks airplane events and offers a simple export tool.
Click here to see the NTSB query tool.
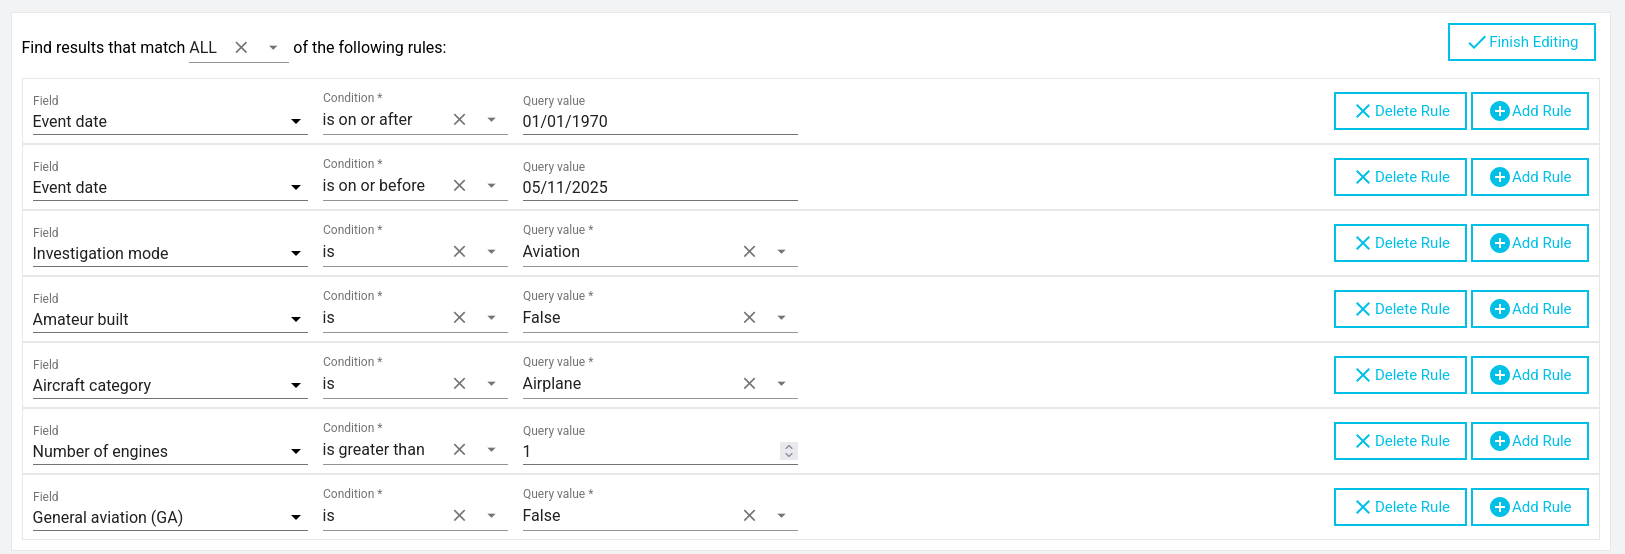
We decided to pre-filter the data to avoid including information about small private plane accidents; here are the filters we used.
Uploading to Google Drive
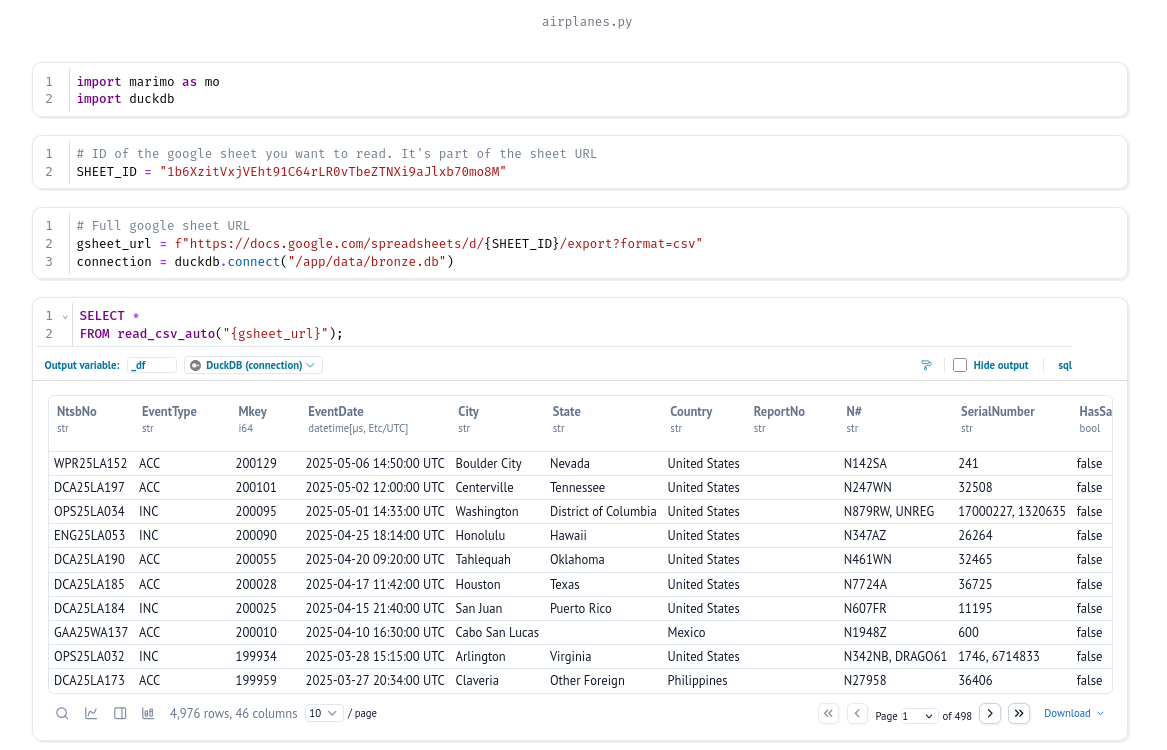
We expect to see 4976 rows in our dataset.
Let’s upload it to Google Drive, as it’s the simplest way to import public data into our data platform.
Importing it into the data platform
Using what we learned in our other blog post, we can easily import our data and check that we still have 4976 rows.
Decide on our analysis
The goal of this small project is to confirm some well‑known facts, like whether incidents mostly occur during landing and takeoff.
We also want to investigate:
- How many incidents happens during taxi?
- How long does it take for a report to be closed?
- Which plane makers are most affected?
- Which operators are most affected?
Exploring the data
Based on the questions we’re asking, we may have some prerequisite work to do:
Incidents during landing and takeoff
For incidents during landing and takeoff, we need to ensure the dataset clearly defines the plane states and how they are used.
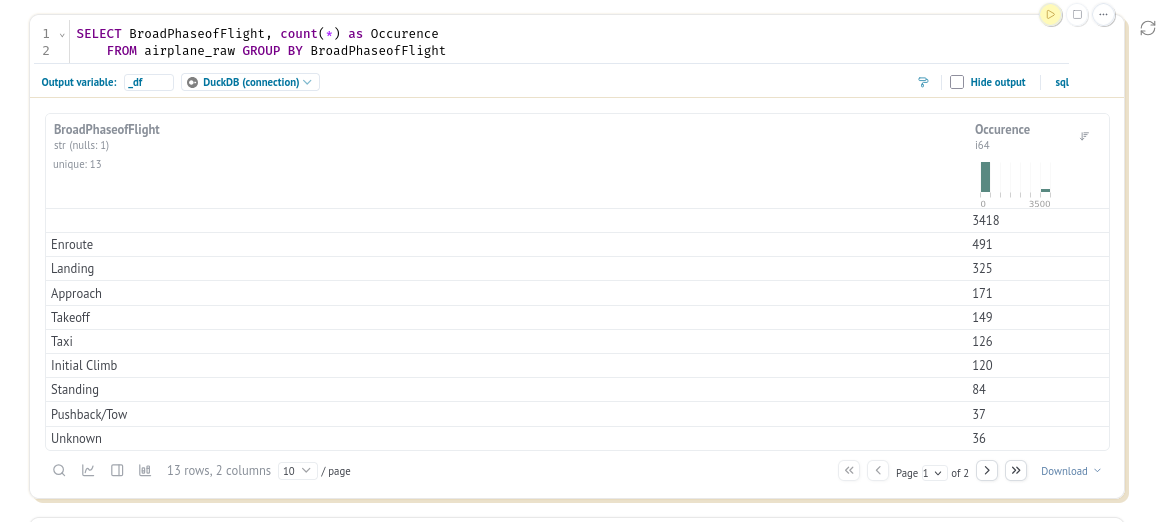
Most records don’t have a phase of flight declared, which is not ideal for us. We may need to investigate why this is the case; maybe only major incidents have this column filled.
Even though we added HighestInjuryLevel to add context on the impact of an incident, the column wasn’t reliably filled.
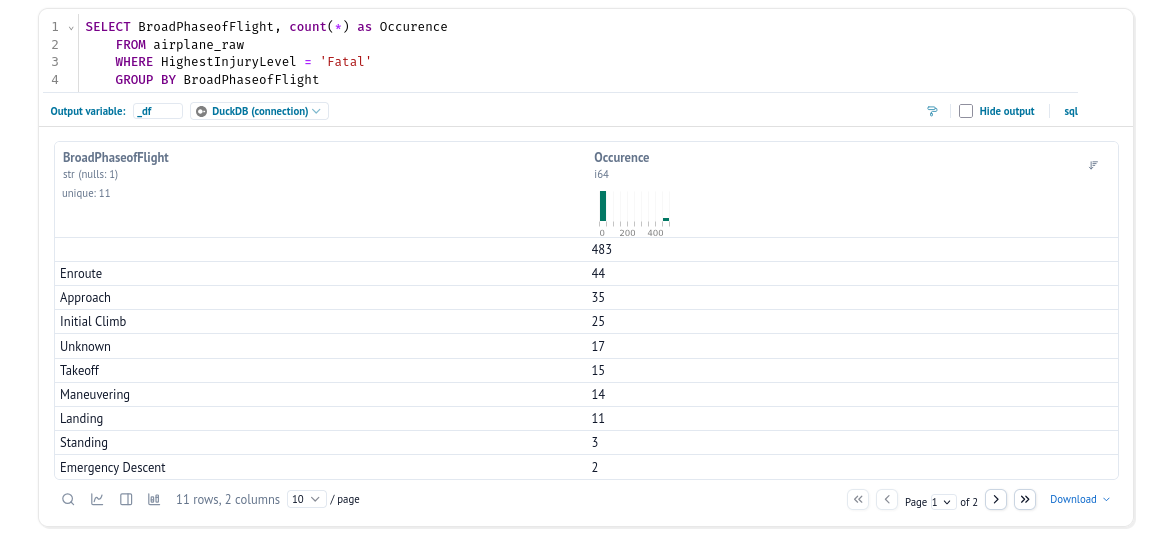
I checked whether the field correlated with another attribute, like country or the presence of a report, but no success. Either I’m missing something, or the dataset doesn’t support this kind of usecase that I wanted to do. Let’s move on to another question.
Report duration
Some incidents are covered by an NTSB report, and I wanted to know how long it takes for a report to be closed.
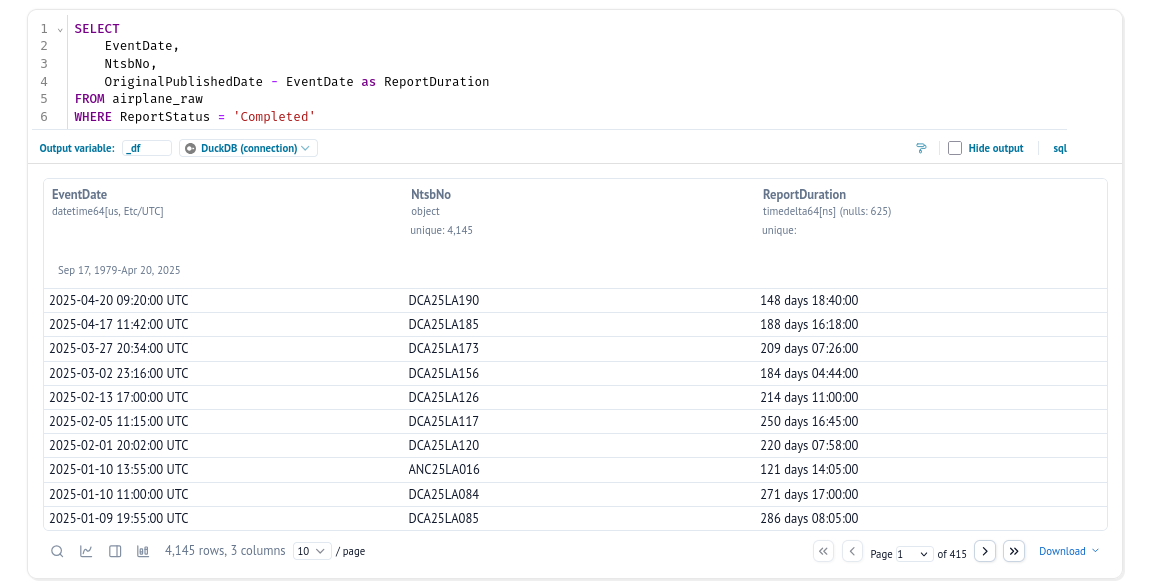
Using this, we find that only 10% of the incidents are covered by a closed report. It’s a similar ratio for open (uncompleted) reports.
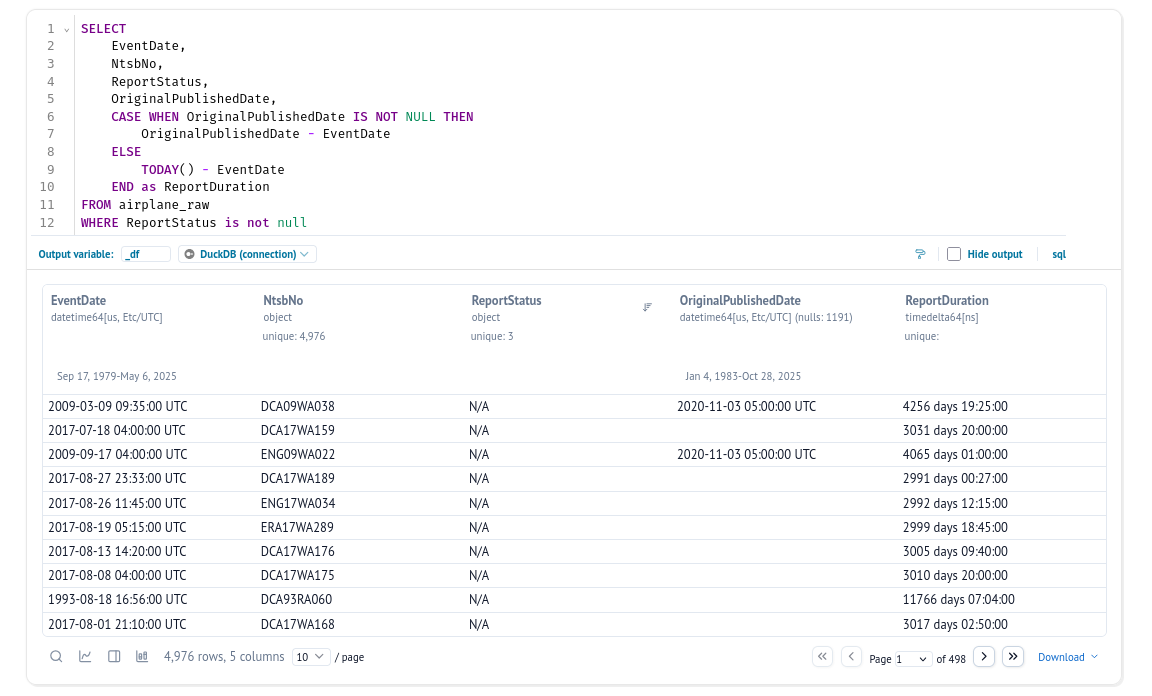
We also wanted to cover open investigations and maybe see how investigation duration evolves through the years.
Let’s model it
We have two possibilities here: either we let Superset, our data visualisation tool, handle the processing and visualisation, or we pre‑process the data beforehand. In most scenarios you will choose the second option. In this case we will simply do a small normalisation step.
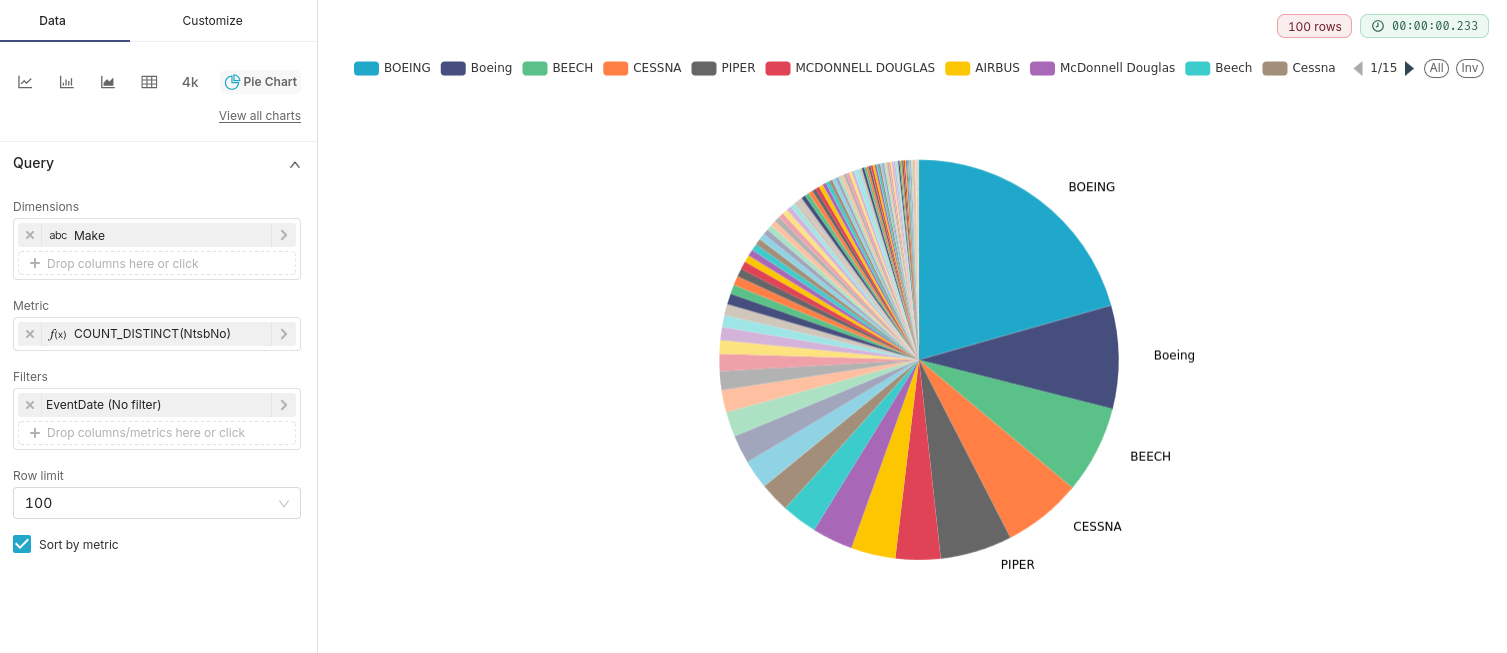
While exploring the data, we found that Boeing was present in the dataset under several spellings. This is a good case for normalisation.
This will lead to using the silver database.
CREATE OR REPLACE TABLE silver_db.main.airplane_data_cleaned AS
SELECT
    NtsbNo,
    LOWER(Make) AS MakeCleaned,
    *
FROM airplane_raw
Our only data processing will be to lower the name of the maker which should fix the most obvious issues.
We could go deeper and handle a table of variants for each maker’s name.
This is where DuckDB really shines: we can very simply create a Python dictionary with our brands and create a table from it.
maker_dictionary = [
    {"name":"Boeing", "options":["boeing", "boeing company", "the boeing company", "boeing - canada (de havilland)", "boeing of canada/dehav div", "boeing commercial airplane gro"]},
    {"name":"Beech", "options": ["beech", "hawker beechcraft corp.", "hawker beechcraft", "beechcraft", "hawker beechcraft corporation", "hawker beech" ]},
    {"name":"Mcdonnell Douglas", "options": ["mcdonnell douglas", "douglas"]},
    {"name":"Airbus", "options": ["airbus", "airbus industrie"]}
]
connection.query("CREATE OR REPLACE TABLE Maker_list AS SELECT x.* FROM (SELECT unnest($data) as x)", params={"data": maker_dictionary})
And store the result like this:
CREATE OR REPLACE TABLE silver_db.main.airplane_data_cleaned AS
SELECT
    NtsbNo,
    COALESCE(ml.name, LOWER(Make)) AS MakeCleaned,
    *
FROM airplane_raw
LEFT JOIN Maker_list ml ON LOWER(Make) IN ml.options
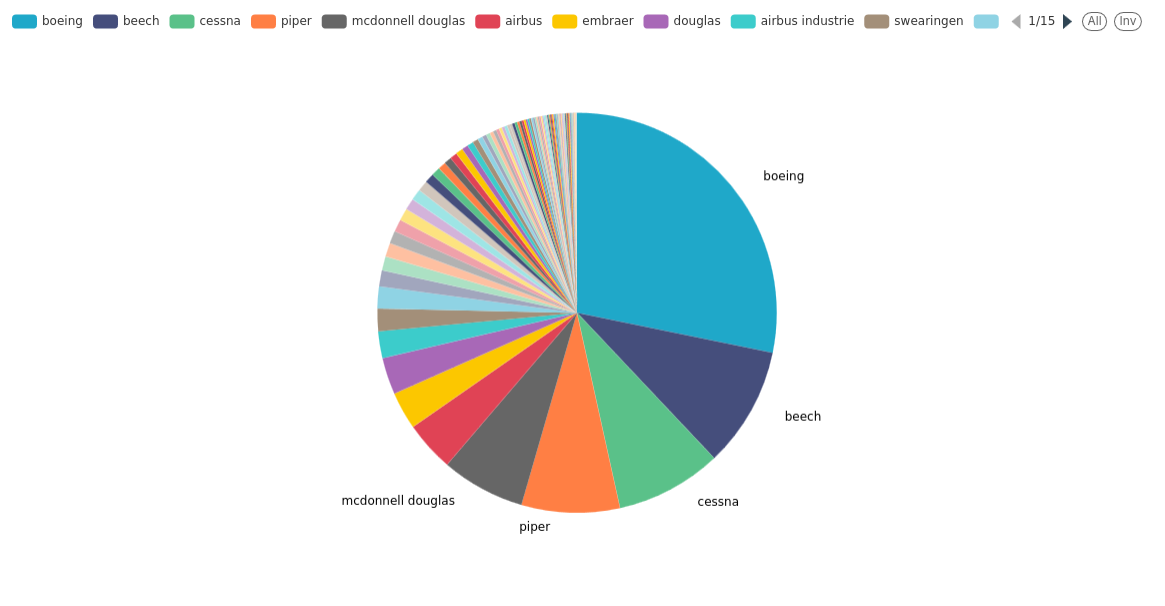
Here is the new result we get:
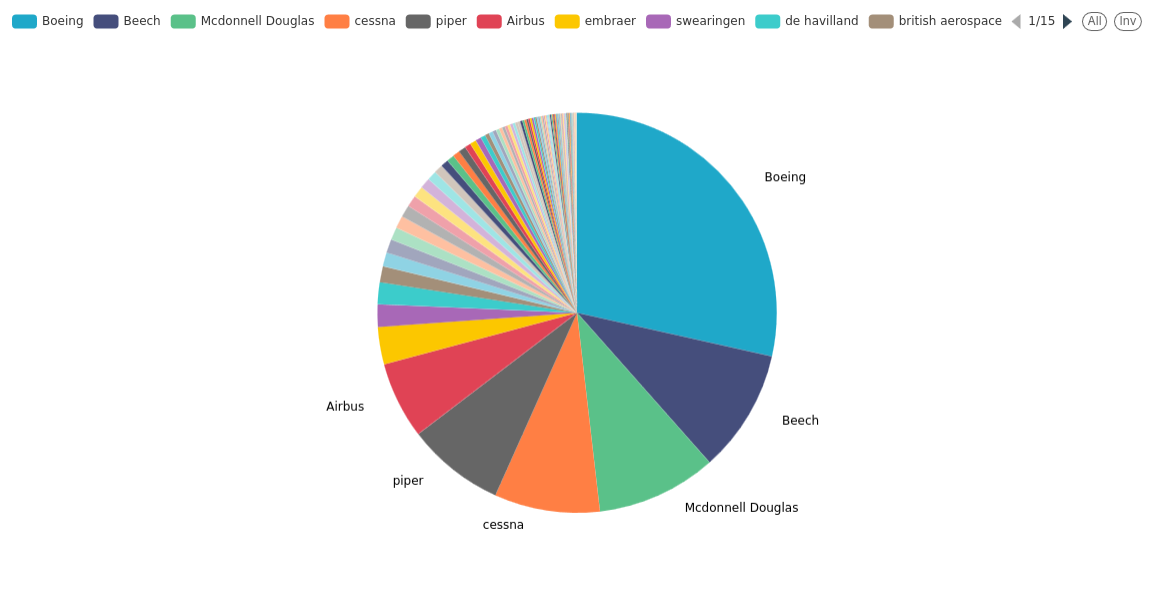
See how McDonnell Douglas got second with this new approach.
Dashboarding
Back to our initial questions:
-
Are incidents mostly occurring during landing and takeoff? We can’t answer this with the data.
-
How many incidents happen during taxi? Due to the composition of our dataset this would not be reliable.
-
How long does it take for a report to be closed? This can be covered.
-
Which plane makers are most affected? After data cleaning, this can be covered.
-
Which operators are most affected? Most of the operators in the dataset have 0 or 1 incident, so it’s not very meaningful to compare this without another dataset.
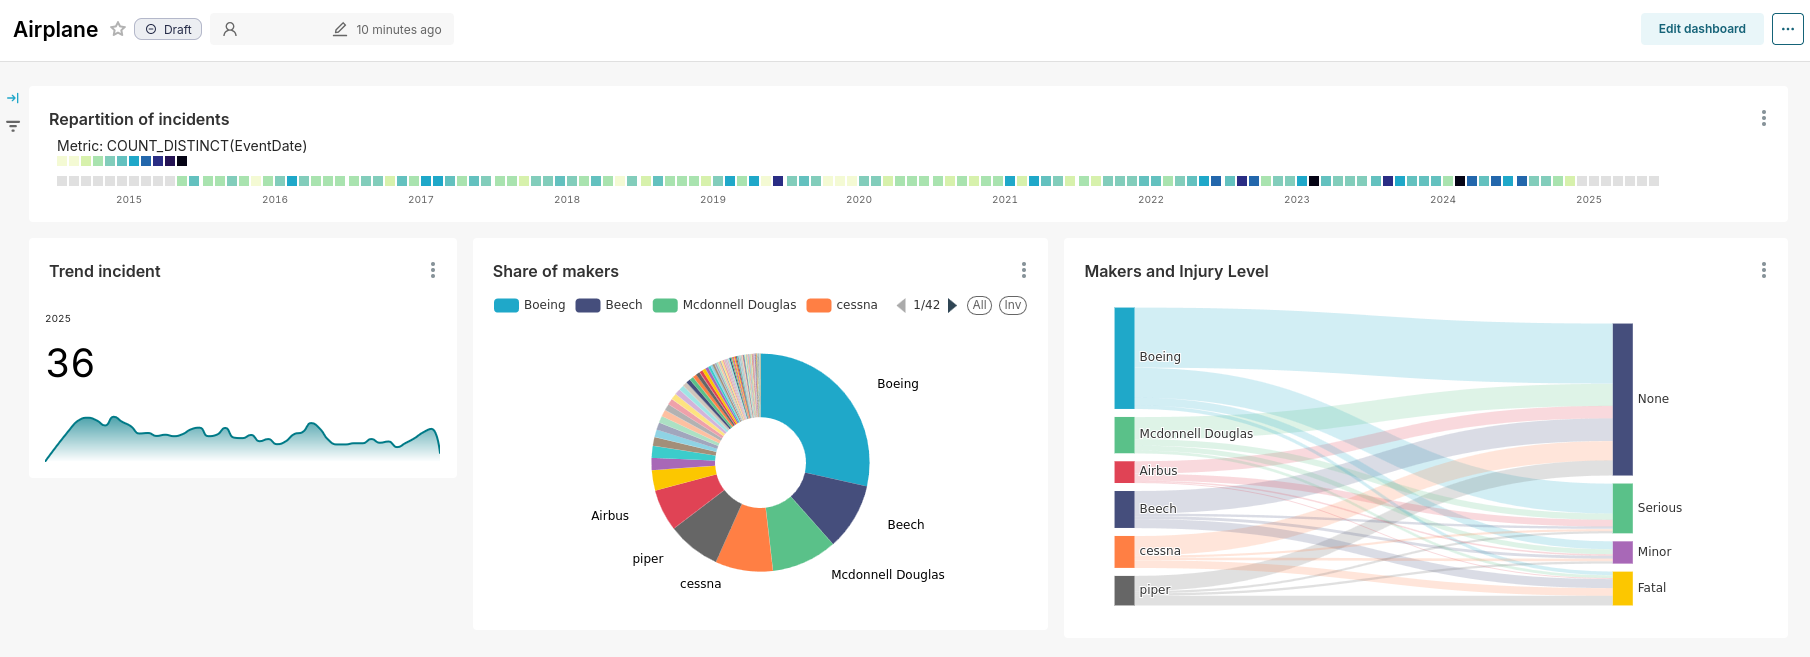
Based on the Sankey visualisation, while it represents a small share of makers (see the donut), small‑plane manufacturers like Beech, Cessna and Piper are over‑represented in the fatal injury level.
Broadening our horizons
Saying who is the most cited airplane maker is not a good way to guess if it’s the riskiest or not.
For this kind of conclusion we need to have information about the number of flights for each model or make.
Hopefully this is where the data platform gets really handy. Add another data source, clean and join the data, and you should be there.