
August 15, 2025
In this blog post, we’ll cover how to import a public Google Sheet into the Telary data platform, browse it, explore the data, and finally build a dashboard on top of it.
Google Sheet
For demo purposes we created a public Google Sheet; feel free to use it—it’s fake data. If you want to use your own data, make sure to change the sharing settings so the sheet is public.
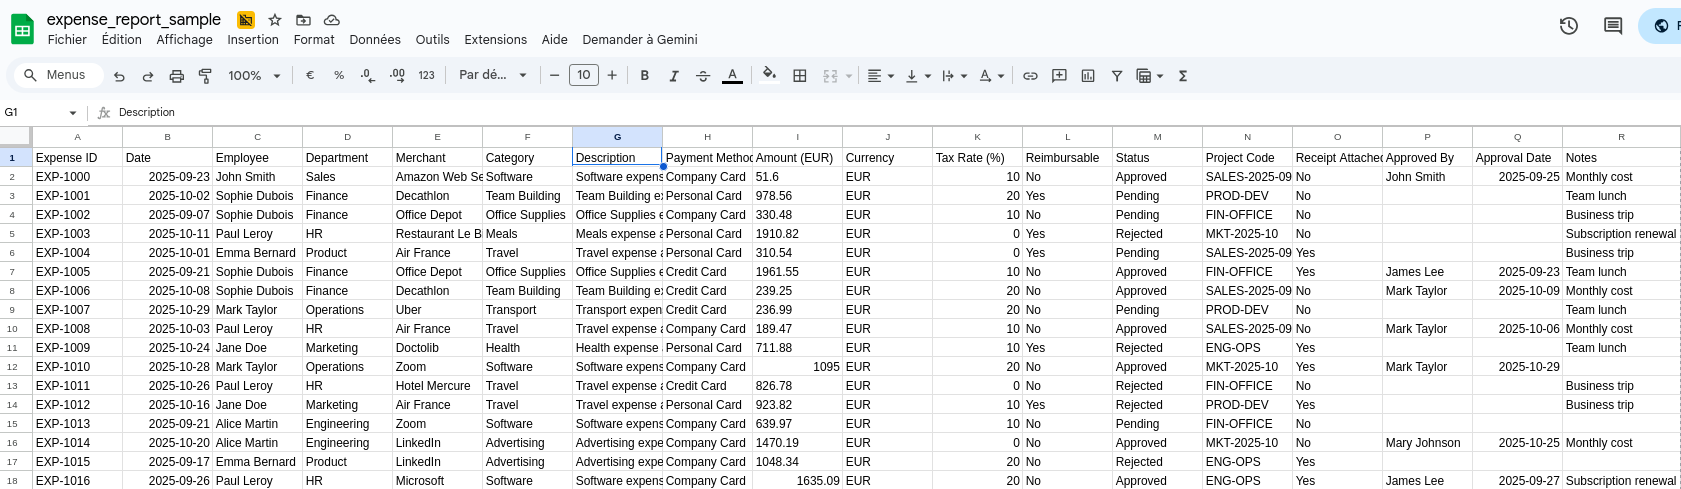
This Google Sheet contains expense report data for a company.
The Python part
In the Telary file browser, click the “New Notebook” button to create a new notebook that we will use to fetch and explore our data.
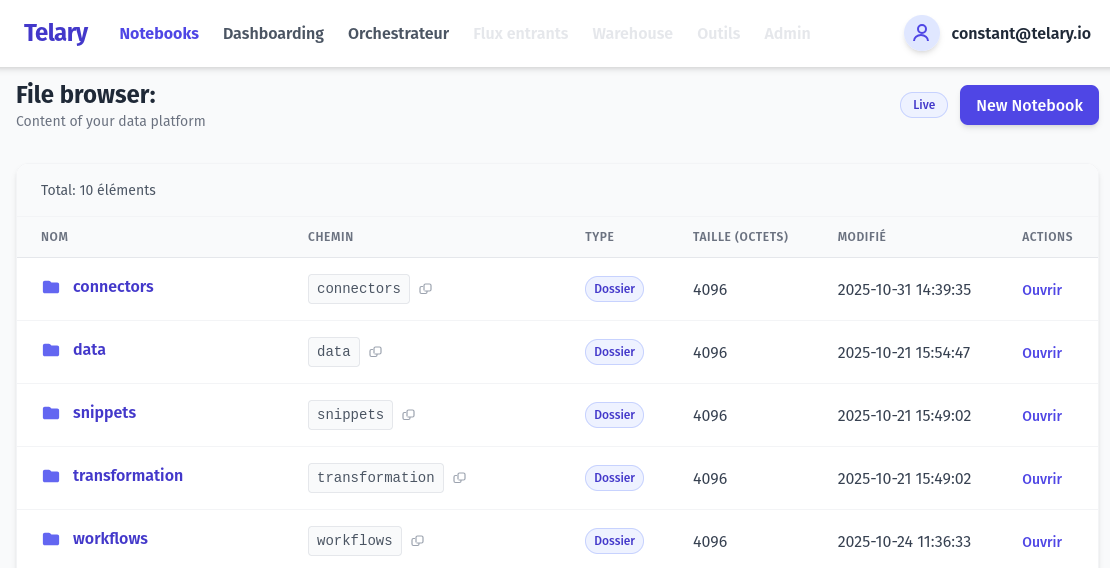
It will create the file at the root of the data platform.
Once it’s created, you can start filling the first code block and adding two more:
# Imports needed
import marimo as mo
import duckdb
# ID of the google sheet you want to read. It's part of the sheet URL
SHEET_ID = "1iFFEZ5ERqXRF8TJVoySmI1MVqrzH7SkFb1aIcr0W4Fc"
# Full google sheet URL
gsheet_url = f"https://docs.google.com/spreadsheets/d/{SHEET_ID}/export?format=csv"
connection = duckdb.connect("/app/data/bronze.db")
This will prepare the good libraries, prepare the URL for google sheet and a connection to our duckdb database. We use the bronze one, because it’s the one you’re supposed to use for imported data.
This will prepare the required libraries, the URL for the Google Sheet, and a connection to our DuckDB database. We use the bronze one because it’s the one you’re supposed to use for imported data.
And we’re done with the Python code.
SQL import
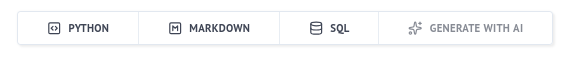
By clicking the SQL button, you will add a SQL cell to your notebook that can directly use your DuckDB connection.
Add the following SQL code inside this cell, and ensure that the DuckDB connection is configured.
# Note that the gsheet_url from the Python cell is usable in this SQL cell
SELECT *
FROM read_csv_auto("{gsheet_url}");
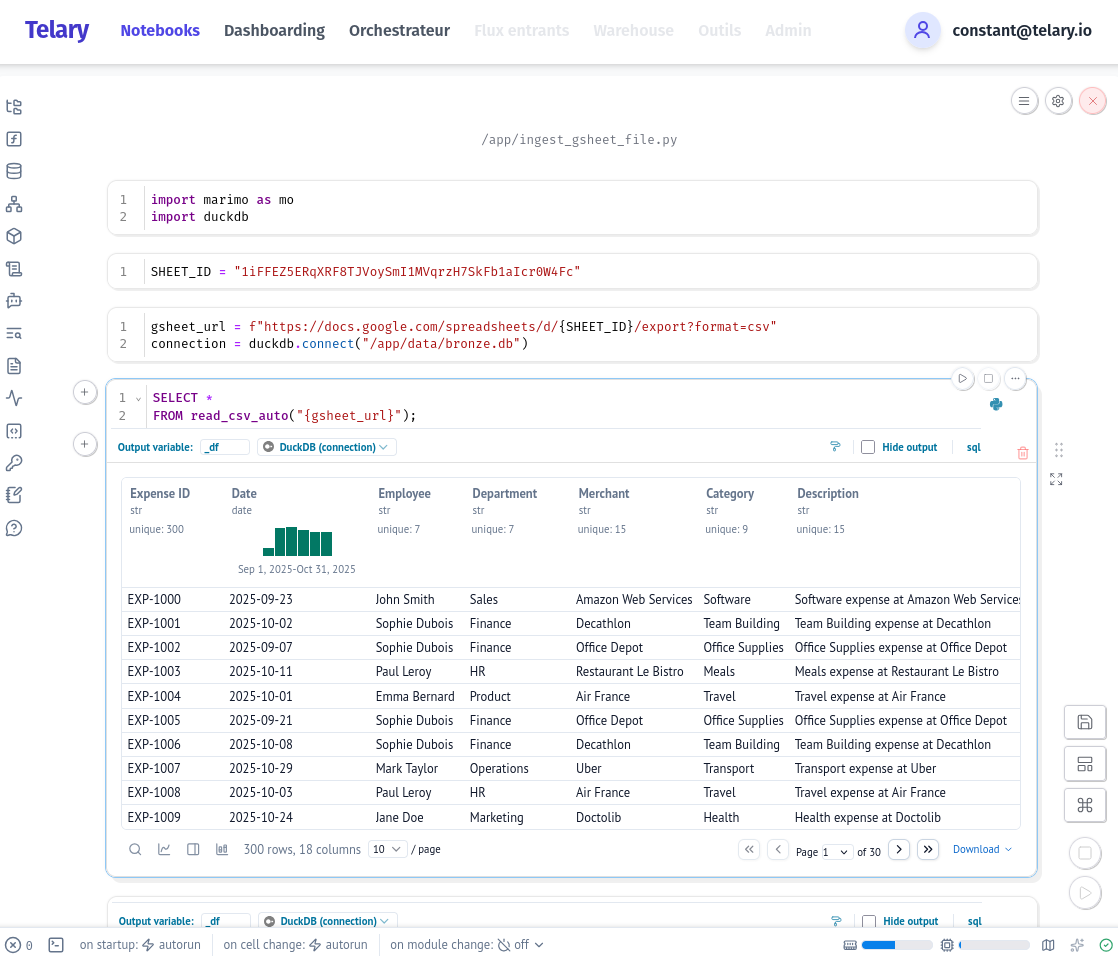
You can see that the notebook displays a preview of the data from your Google Sheet—that’s a big first step. Take a look at the upper part: you have a widget giving you information about the data. That’s neat when you want to check that the import was successful.
Saving data on the platform
Up to this point the data was fetched from the Google Sheet and not saved on our data platform. You will probably want to save it. It’s as simple as creating a new SQL cell and adding the following code.
CREATE OR REPLACE TABLE expense_report AS SELECT * FROM read_csv_auto("{gsheet_url}");
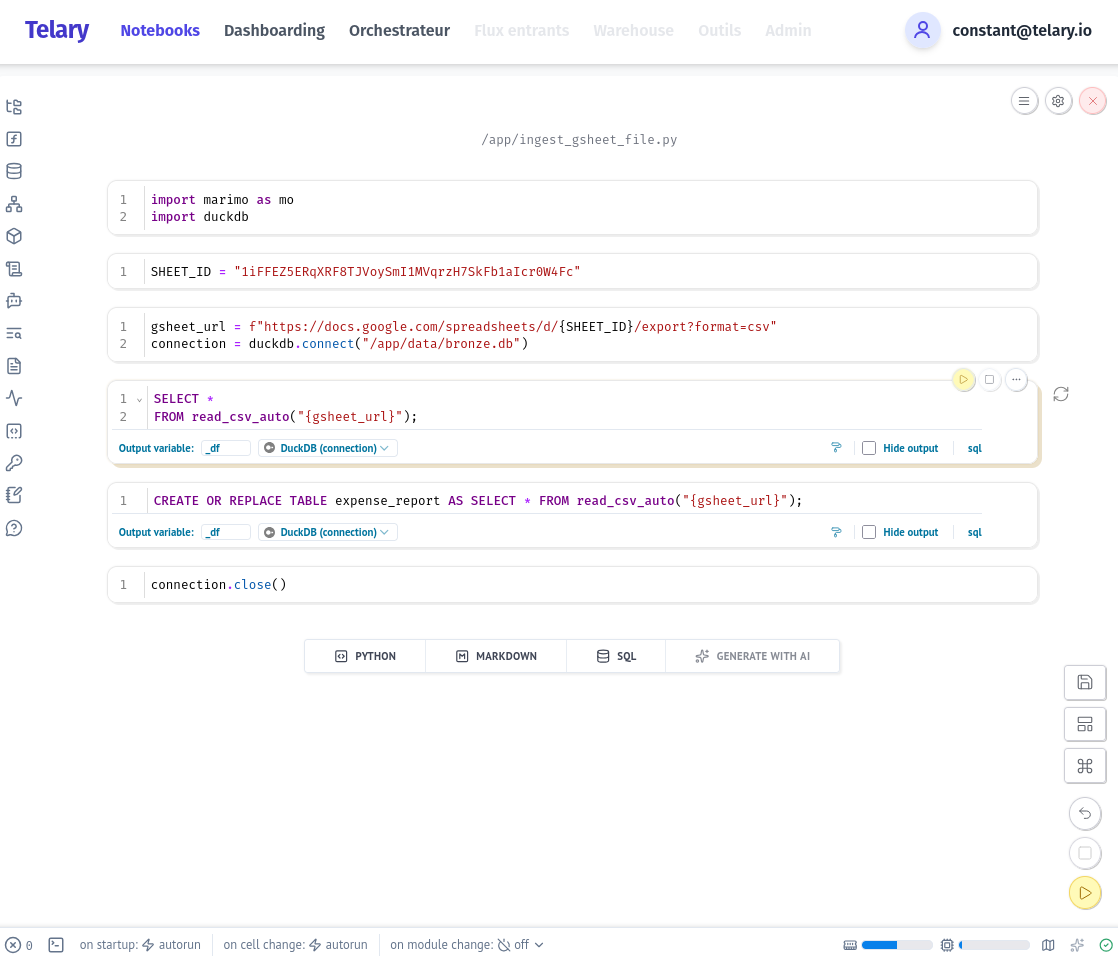
The full notebook should look like this:
Building a dashboard
Now that the data is saved, we can build a dashboard on top of it.
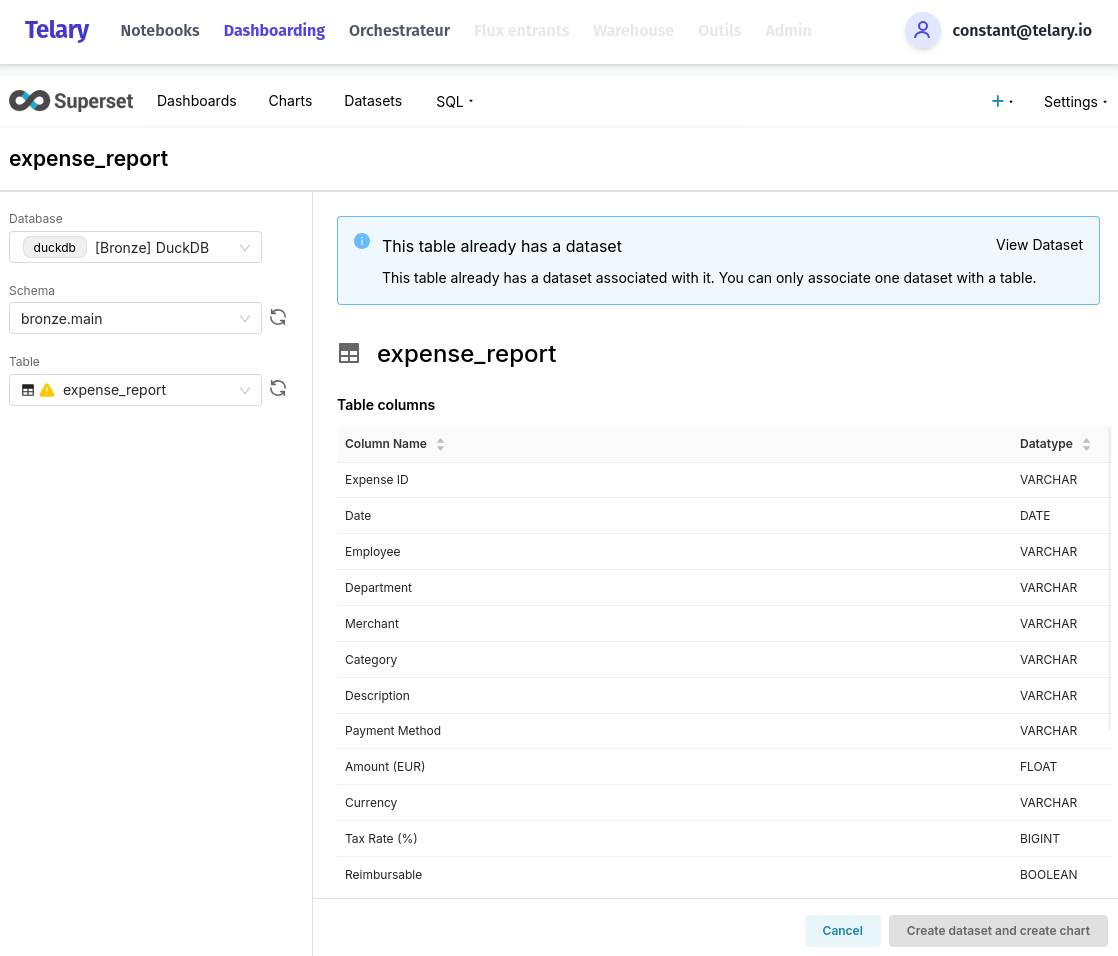
Click on “Dashboarding” and then the “+” sign in the upper-right corner. Then “Data” and “Dataset”.
Select the database “[Bronze] DuckDB”; the schema should be “bronze.main” and the table “expense_report”.
Once you have created a dataset you can use it in the chart tool to create your first chart.
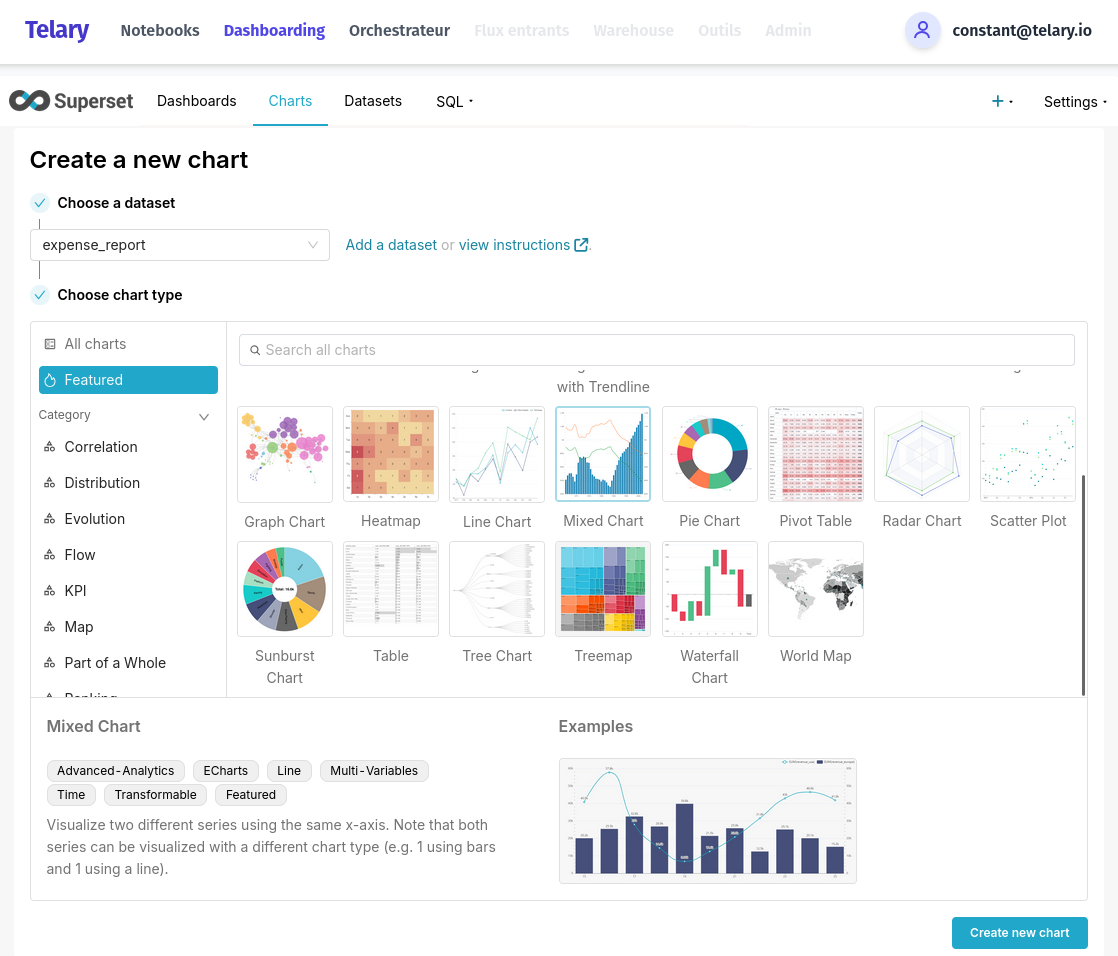
Select your type of data visualisation and click “Create new chart”. Drag and drop the fields you want to see in your chart, and don’t forget to check the chart result as often as possible.
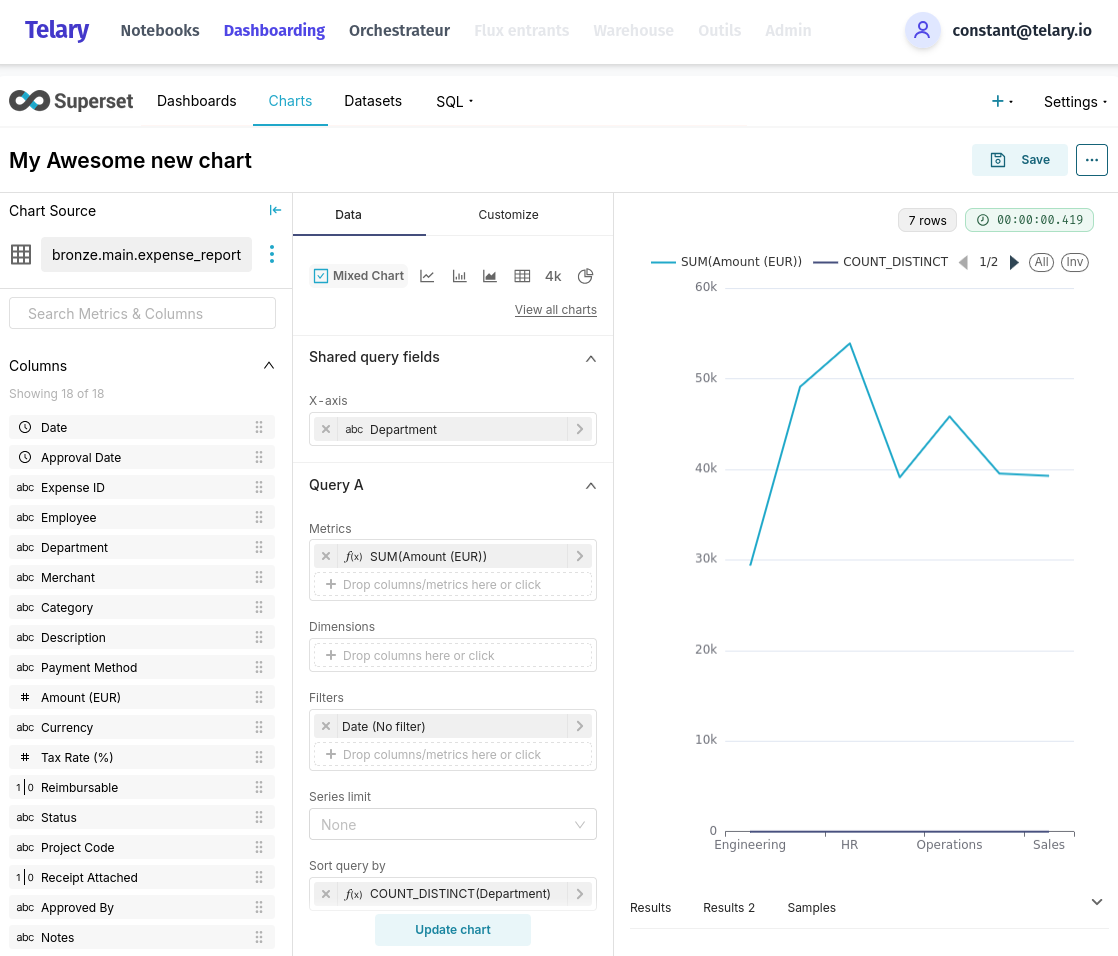
When you’re done, add it to a dashboard and you will be able to have some good-looking dashboards.
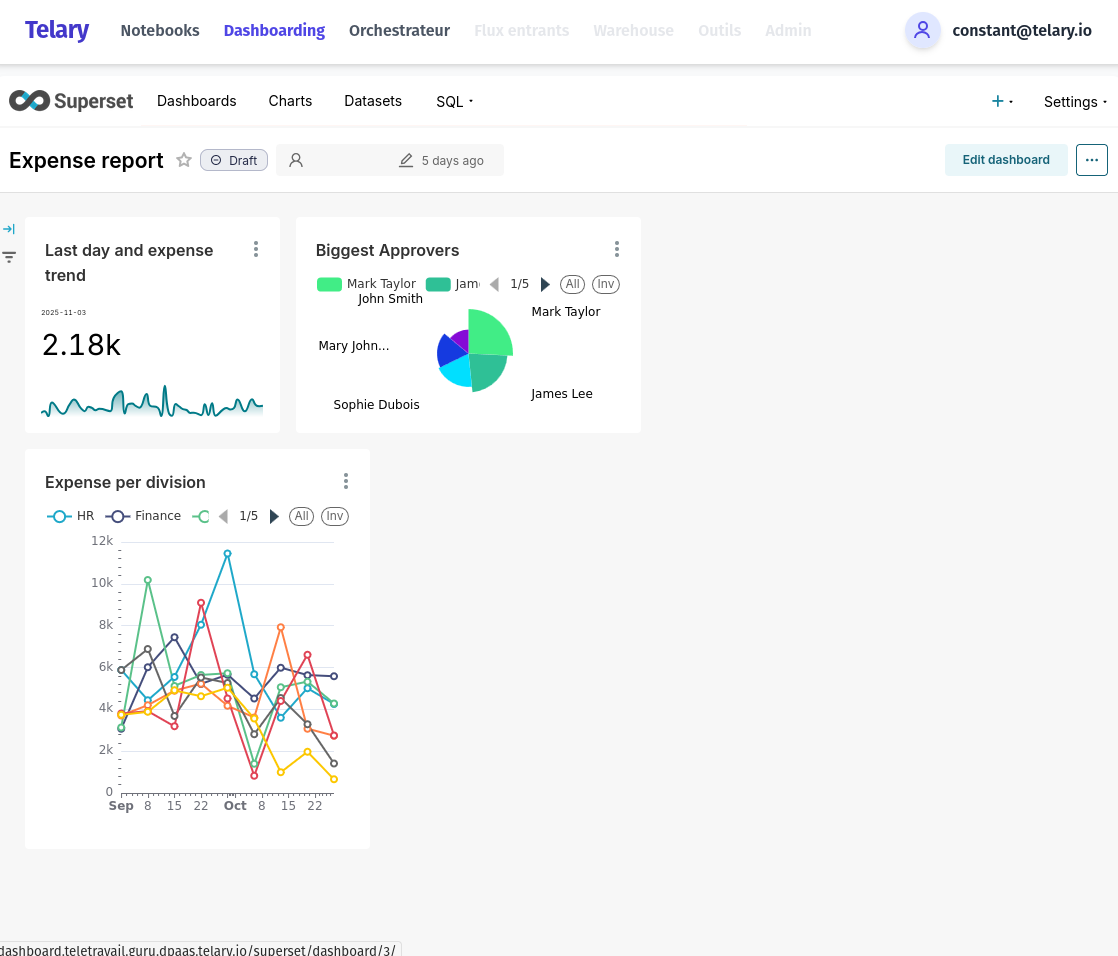
Conclusion
That’s it! We’ve shown you how (with a few lines of Python and SQL) you can import Google Sheet data and build insights on top of it. Telary is a way for SMBs to have a quickly available, easy-to-use, and cost-effective data platform.